See your edge in numbers.
Win rate is vanity. Deltara computes expectancy, drawdown, R-multiples, and 80+ institutional-grade metrics — split by strategy, asset, hour, weekday, and plan adherence.
See pricing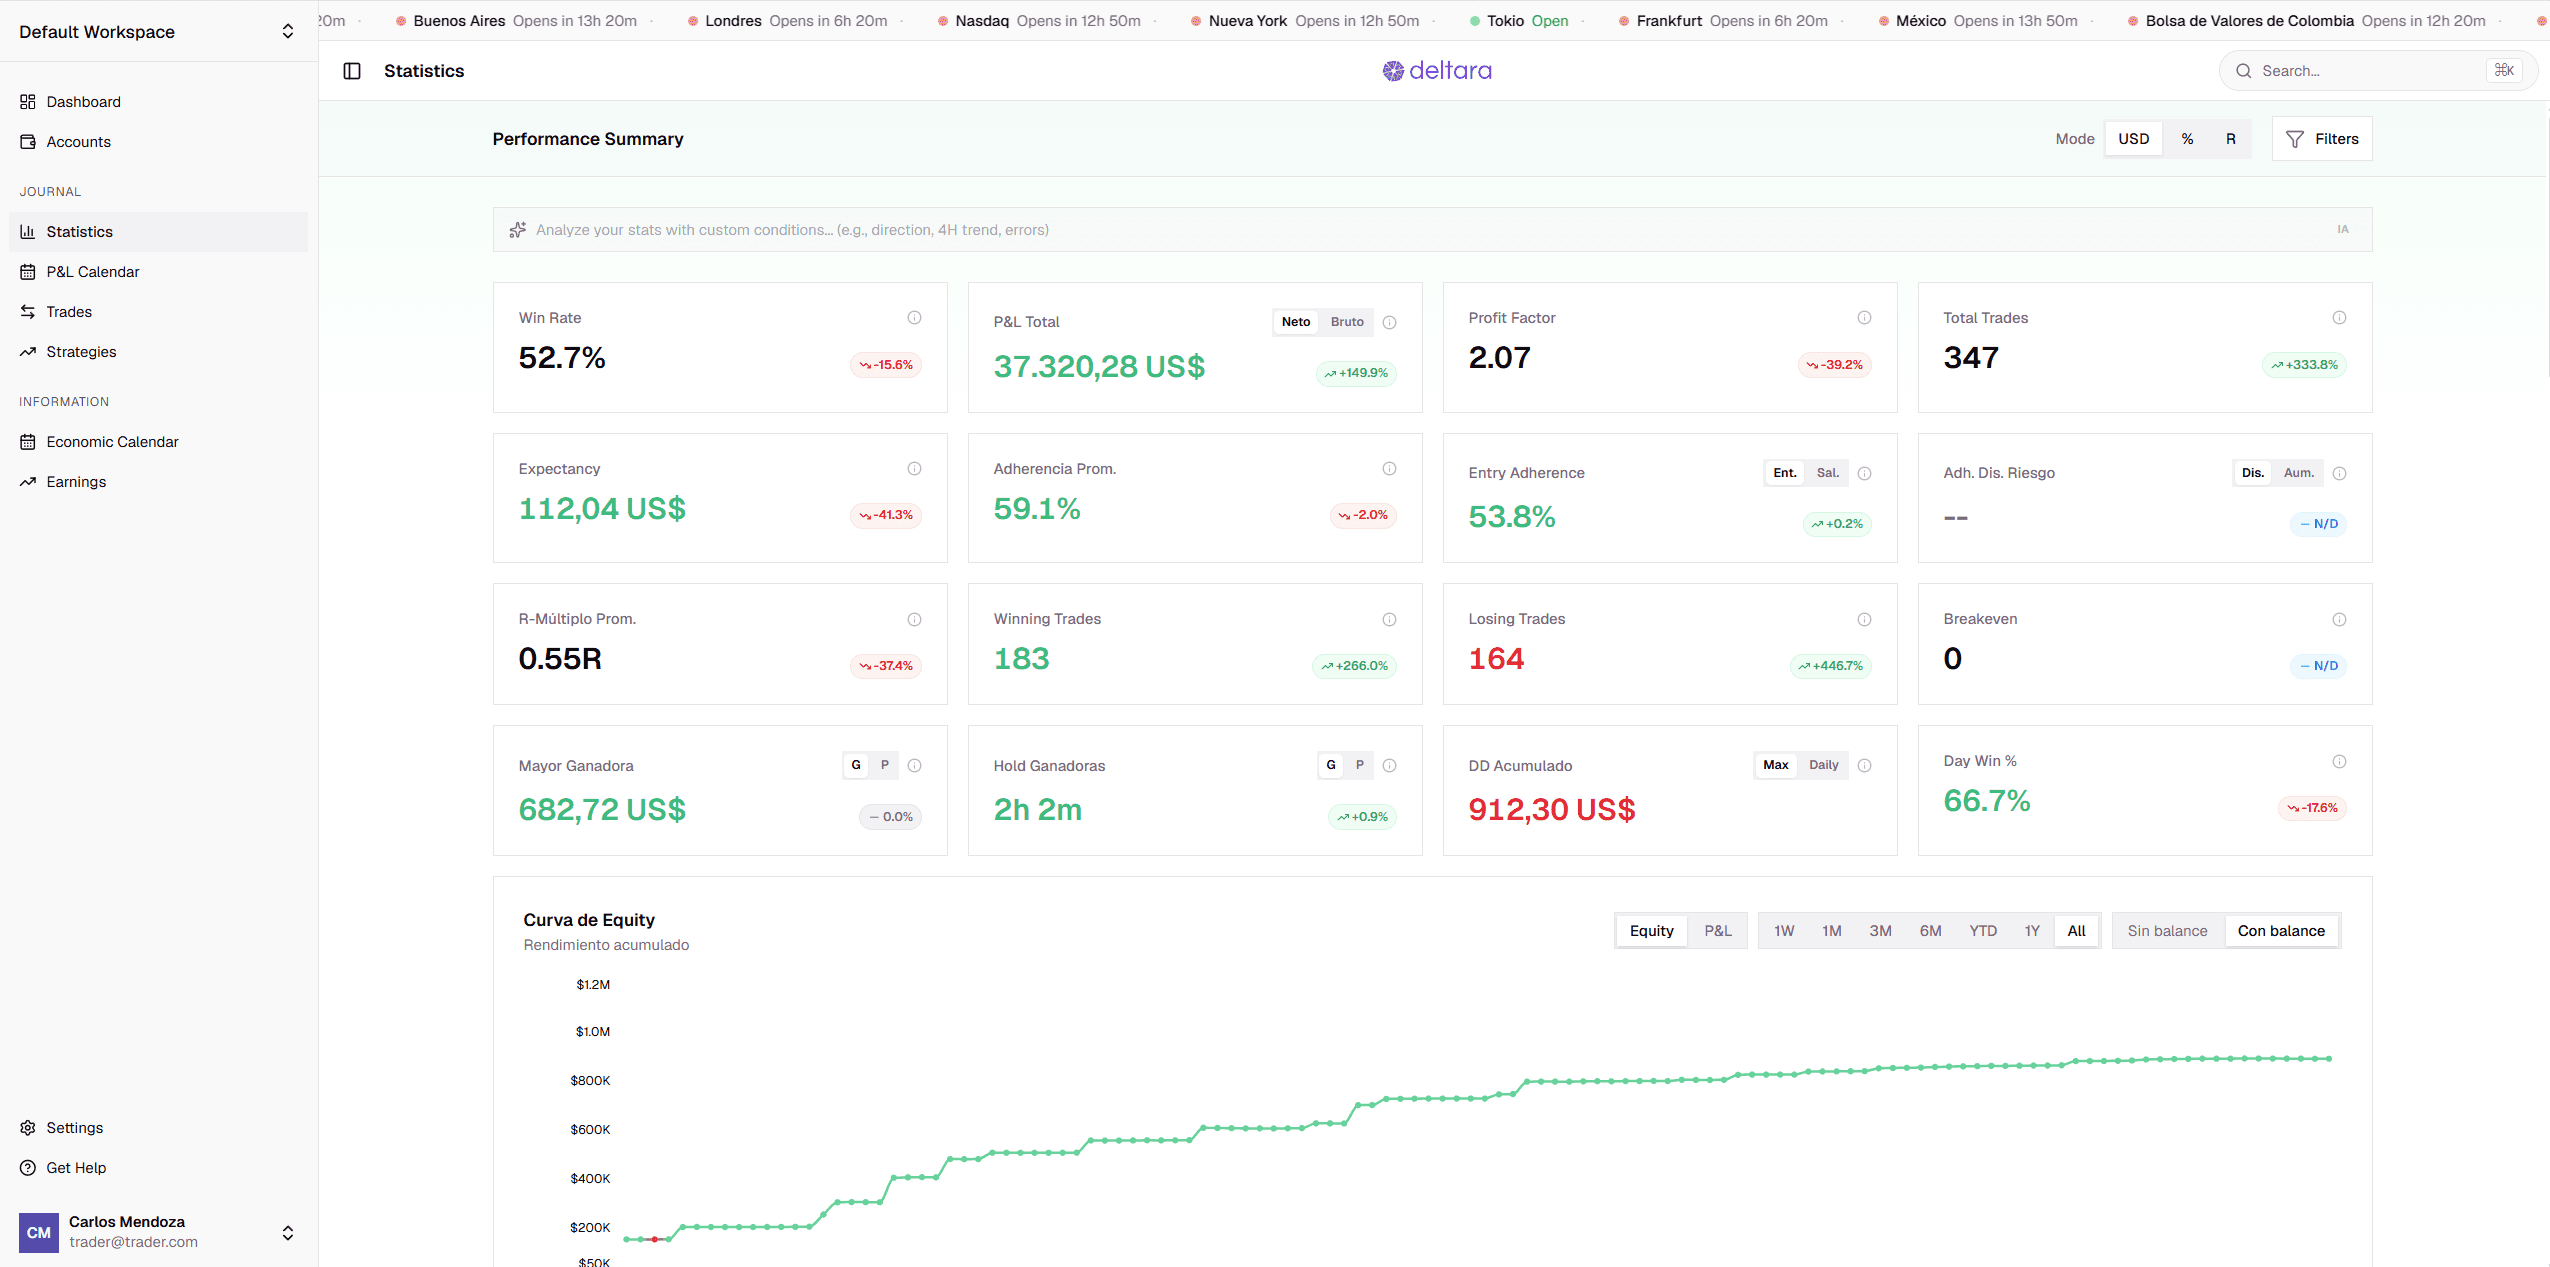
An equity curve built like a trading terminal.
Zoom from years to hours: Deltara's equity curve re-resolves as you navigate — daily, hourly, or trade-by-trade — with deposits, withdrawals, and goals drawn in context.
- Multi-resolution zoom: day, hour, and raw trade level
- Deposit and withdrawal aware baseline
- Goal lines and loss limits drawn on the curve
Custom and personal, not generic.
Your statistics adapt to your setup: filter any metric by strategy, account, asset, setup, weekday, or session hours. Build views around the questions you actually have.
- Filter and combine across every dimension
- Per-strategy and per-account dashboards
- Breakdowns by weekday, hour, and asset

The numbers institutions use.
Expectancy, profit factor, drawdown recovery, streak analysis, R-multiple distributions, risk-adjusted returns — computed correctly, in your timezone, on integer-precision money math.
Be first in.
Join the waitlist and get early access when Deltara launches.
No spam. One email at launch.